
When asked in relation to video deployment, 58% of IT executives want to be able to monitor network performance. Video delivery is becoming a big part of how companies conduct business, both from a customer facing and employee facing perspective. From an internal point of view, employees and stakeholders are now actively being trained and addressed through video content, ranging from internal technology training to executive town halls. Under certain setups that feature a large, centrally located audience, this presents a challenge to scale without harming the network. An issue that raises that need to monitor network performance by those in IT.
This need is addressed by technology called ECDN, or Enterprise CDN. This article discusses what is an ECDN and how it works. It also covers ways that administrators can monitor them and the benefit of strain reduction to the network. IBM Watson Media has also recently enhanced its monitoring capabilities for its ECDN offering, which are highlighted as well. It also includes data from a joint IBM and Wainhouse Research report, which interviewed 1,512 executives to see what elements they place importance on for their video solutions. The full report can be read here.
- What does ECDN stand for and what is it?
- Benefit of using ECDN
- ECDN performance example
- Monitoring ECDN instance
What does ECDN stand for and what is it?
Short for Enterprise Content Delivery Network, ECDN works like a locally installed edge server. In fact, it’s a virtualized CDN edge in an internal network that caches video assets to provide local scale. This prevents the necessity to upgrade the network to handle this additional load. This is because the cached assets reduce the stress on Internet and WAN connections. As a result, local congestion issues caused by employees or other on premise users all trying to access resource intensive processes, in this case video streaming, are reduced.
Benefit of using ECDN
71% of technology executives see it as very important to distribute video content without harming the corporate network. 16%, in fact, will not deploy unless it has a feature to address this. The Enterprise Content Delivery Network is directly positioned to address this need. At a high level, using ECDN reduces the chance of placing too much strain on the network and overloading the firewall. It can also improve video quality, assuming adaptive bitrate delivery is present, and helps to eliminate buffering on a broadcast.
Use cases for the technology can range, although it’s commonly used to scale video delivery inside an enterprise. All hands meetings, training, executive town halls and other internal video use cases can be taxing on the network. ECDN would reduce the load to just a few streams. Although many of the uses for this technology are internal facing, there can be external broadcasting uses as well. Schools also benefit from this technology, for example, by being able to reach their students and faculty without harming their location network.
ECDN performance example
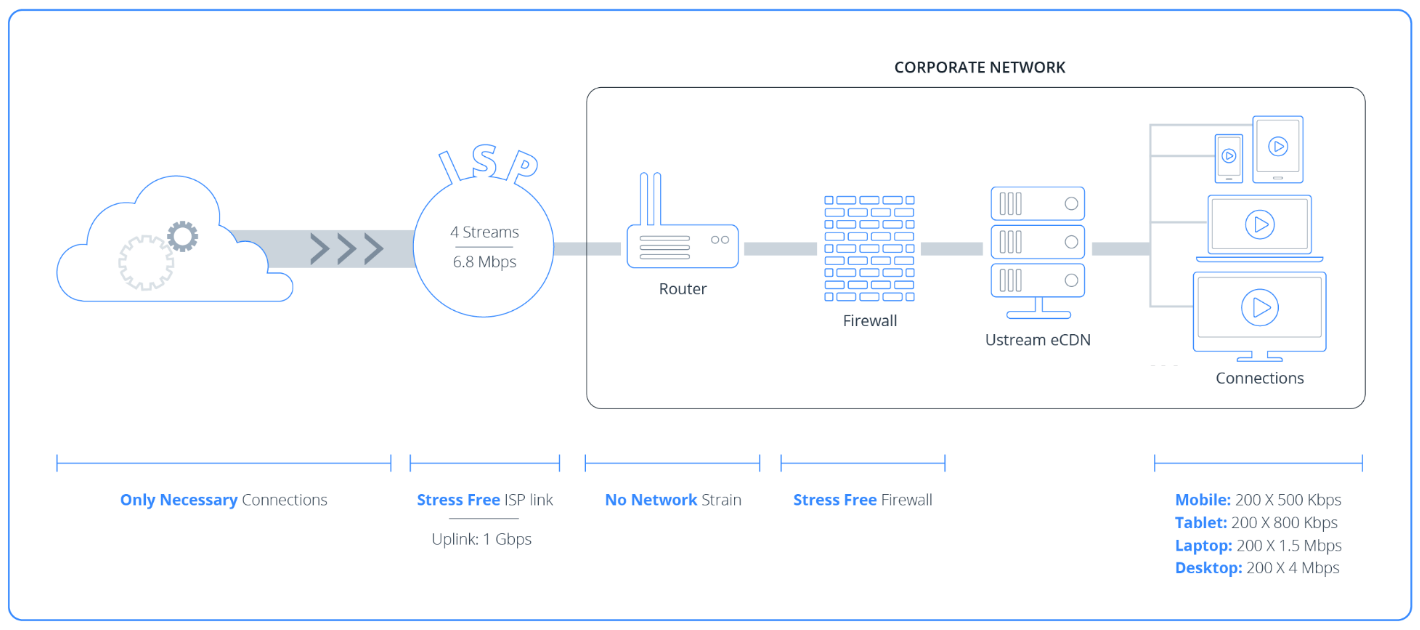
To track performance of ECDN, it helps to contrast an installation with and without the technology. For example, 2,000 employees all trying to watch the same high definition (HD) executive town hall from inside the office can easily create too much strain on the local network. In this example, let’s say their combined consumption would be 3.4 Gbps. Unless that connection is fast enough to support it, chances are that will have a negative impact on the local connection. This means not just hampering people from watching the stream, but a negative impact on other processes that require the Internet.
In contrast, if ECDN was installed in the example above, the total strain would drop from over 2,000 streams to likely around 4. The 4 number comes from the varying bitrate options, which might be served in this example. The great news is that the strain on the network would be dropped from 3.4 Gbps to a very manageable 6.8 Mbps, as seen in the diagram below.
Monitoring ECDN instance
58% of technology executives cite 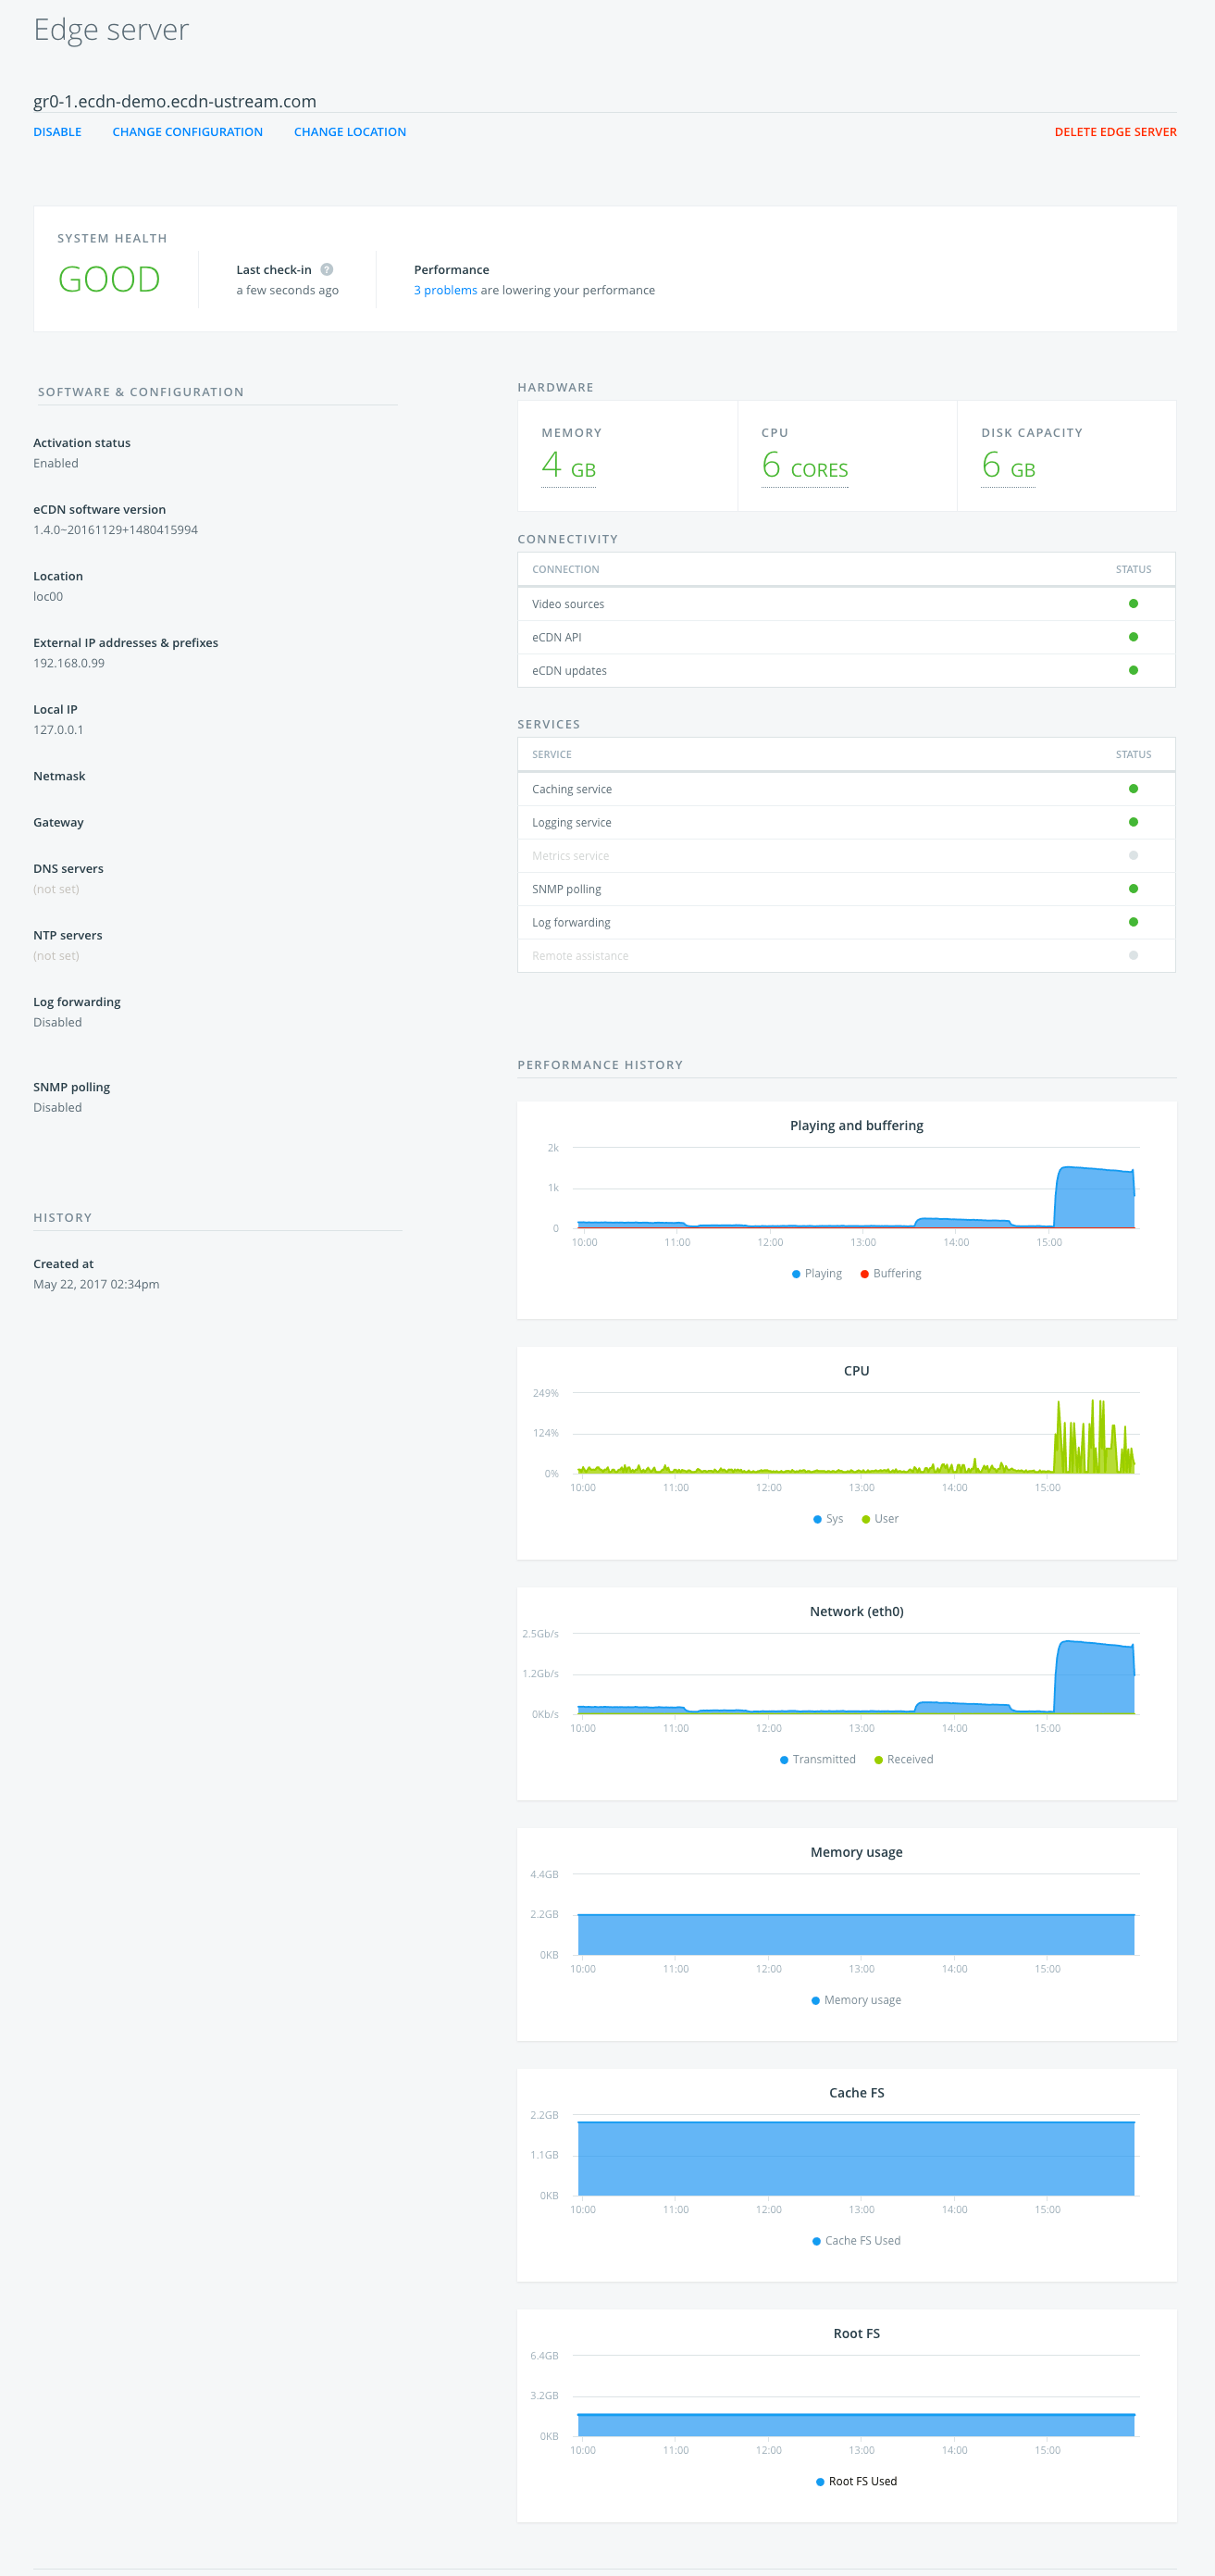 the ability to “monitor video delivery performance to troubleshoot network problems” as either mandatory or very important. As a result, being able to track how the ECDN virtual edge servers are performing becomes a priority. With IBM’s ECDN, this information is accessed from a website dashboard. Being accessible in the cloud, this allows ease-of-use checking by an administrator. In fact, it can even facilitate the need to check when an admin is working remotely or out of the office. The latter can help to scale staff as well for multi-office corporations. This is because the ECDN dashboard can link multiple locations and instances together. For example, an enterprise might have an office in both San Francisco and Tokyo, both with their own ECDN installations. Both of these can be accessed and checked from the same panel.
Network administrations can even dive down to see details directly related to the edge server, seen to the right. This view provides a rich amount of data, both in relation to what services are enabled for the edge server and performance tracking.
Below is a rundown of this information and how it relates to the installation.

The immediate value of this page is that it gives a quick system health check of the edge server. This will sum up the data on the page into a single ranking, for example it might be listed as “good”.
It also gives recommendations on the performance, if any known issues have arisen or any potential issues have been detected. Sample issues include memory and disk usage on the server where it is installed. It also will track the volume of concurrent connections as well. ECDN supports multiple instances at the same location, with built in redundancy processes, to support huge audiences that a single instance will not. Furthermore, these extra edge instances are managed all from the same dashboard.
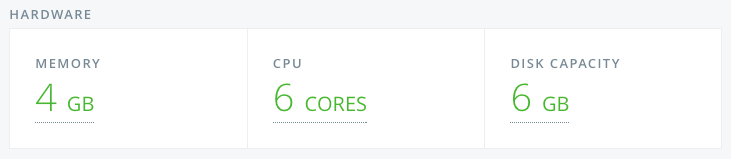
The next bit of information is tied to the server that the virtual instance is on. ECDN requires a minimum of 4GB of memory, 4 cores of CPU and 4 GB of disk capacity. Assuming these requirements are meant, these three categories will appear in green.
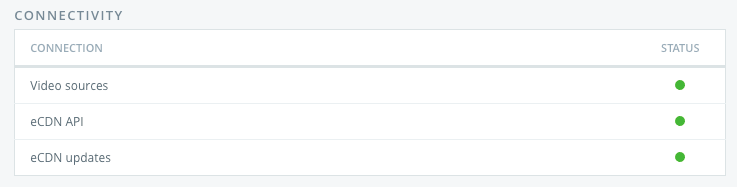
Now the connectivity area relates to a quick status check for three different services that ECDN provides.
- Video sources
The ECDN instance is fetching the video chunks from these upstream servers. The green status means its the endpoints are reachable. - ECDN API
Manages machine registration and also related to the periodic health checks, such as the monitoring the information found on the Edge Server page. - ECDN updates
This automatically updates endpoints and manages overall updates to ECDN. When an update is in progress, the system health message will be replaced by “Pending Update”.
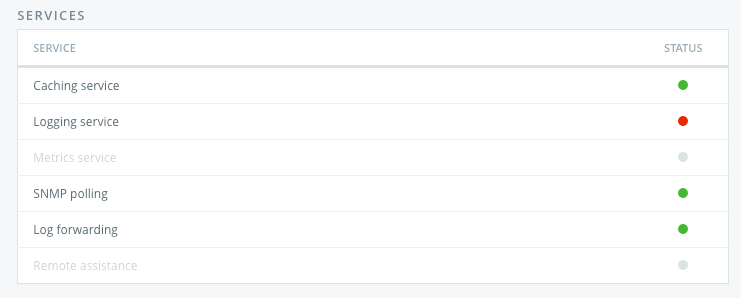
The services area monitors a variety of different functions of ECDN. Some of these relate to general functionality, while others reference features that have to be enabled or opted into and relate to support and assistance.
- Caching service
While the “video sources” listing under connectivity related to receiving video chunks, this denotes not just fetching the chunks but then distributing them to potentially large audiences as well. If the status is green, it denotes that the ECDN installation is sending the video chunks to viewers. - Logging service
This writes all the logs to disk and then sends them to IBM Watson Media for monitoring as well. - Metrics service
This service collects CPU, memory and disk utilization metrics. It then sends this data to IBM Watson Media for monitoring. - SNMP polling (optional service)
This service is also used to collect CPU, memory and disk utilization, but then to output this information in a metrics monitoring tool of your choosing. You can also then use the alerting methods you use for your other servers as well. - Log forwarding (optional service)
Collects the web service and other logs into your logging system. - Remote assistance (optional service)
This grants permission for IBM Watson Media engineers to analyze your setup and logs to help resolve issues for you. You can leave this service on, to speed up remote assistance in the future, or turn it off after the debugging session is over.
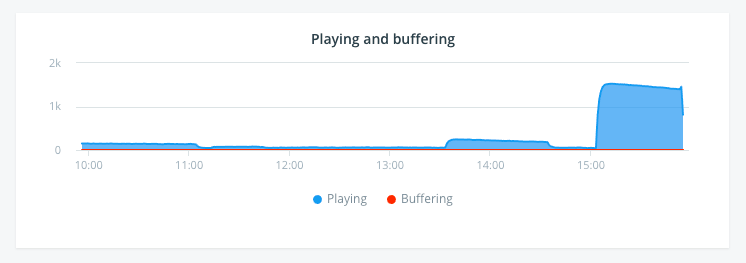
Next we are introduced to a series of graphs and charts relating to performance of the ECDN edge. Each of these charts presents one or two points of data. A set of data can be disabled by clicking on the name of that set of data. For example, someone can focus just on how many viewers experienced buffering by clicking on “Playing”, which would disable this data for the view.
Now the first chart relates the number of plays over a seven hour period of time, the second relates how many viewers experienced buffering as well. This performance can be seen at a glance, or administrators can highlight over a specific point for a time stamp and exact information related to plays and buffering for that point. This highlight feature works down to the minute for content.
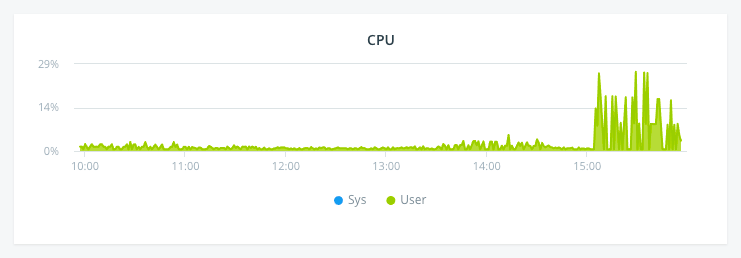
Denotes the CPU usage of the instance. The exact “max” will depend on the number of cores in the instance, as each core is 100%. So a 6 core instance, for example, would have a maximum of 600%. CPU utilization rarely goes above 20% even under load.
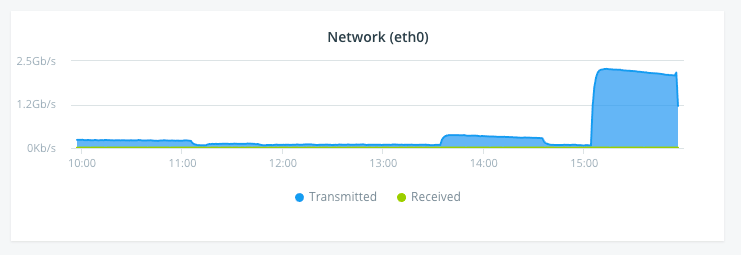
The network chart displays the amount of information transmitted and the amount of information received by the instance as well. This gives a visible point of reference for how much strain was reduced as a result of the ECDN instance as well. For example, you could scroll over a point and see that the system was receiving 9 Mbps worth of video chunks while transmitting 2.21 Gbps worth of video to viewers.
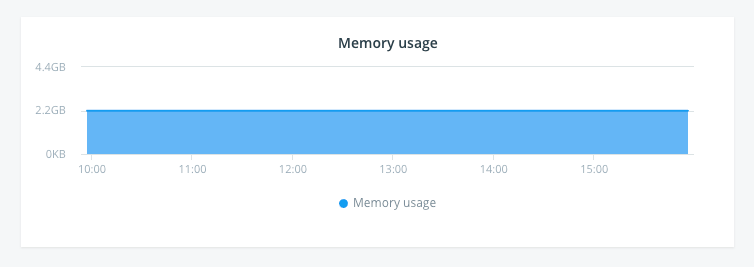
The memory usage chart shows the total memory consumption by the OS and all running processes. ECDN requires a minimum capacity of 4GB of memory. However, as seen in the data above, this doesn’t necessarily mean that even 75% of that total will be routinely used. As with most processes, though, having memory in excess of the minimum is ideal.
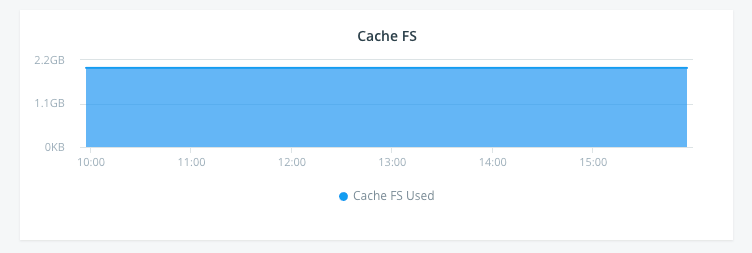
The Cache FS is used by the Caching Service tracks the amount of video chunks that are currently cached by the ECDN instance. The size is calculated at boot. From the memory that is reserved for the virtual machine 2GB is allocated for the OS and the remainder for the Caching Service. On a fresh instance, the cache will be low and then will build up. Video chunks and playlists are cached for a default 2000 minutes (33.33 hours).
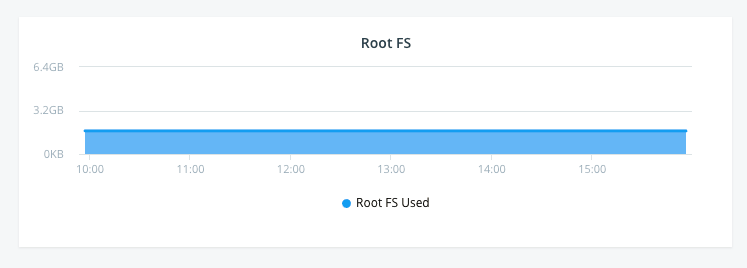
If Root FS and root filesystem are unfamiliar terms, a more in-depth explanation is provided here. In a nutshell, the root filesystem shares the same partition, an independent section of the hard drive, as the root directory. This area should stay relatively uniform, as it denotes the OS for the instance.
Summary
ECDN technology can be a great way to scale video delivery inside an organization. It can improve video quality while dramatically reducing strain on the network. Furthermore, tools are available to help administrators monitor network performance as it relates to the ECDN instance as well. Accessible in the cloud, IT can also begin to troubleshoot issues remotely, understanding the issue before they might even arrive in the office.
Want a free demo of ECDN? Sign up and walk through the offering.
To learn more about the installation process, read our ECDN deployment & system configuration article.